Wednesday, April 1, 2015

Moore's Law, Cloud Computing and DW/BI

What is Moore's Law?

    Nearly half century ago, a young engineer named Gordon E. Moore predicted mammoth changes in the field of electronics in the decade ahead. He foresaw a future with home computers, mobile phones and automatic control systems for cars that there would be a steady doubling, year after year, in the number of circuit components used would be economically packed on an integrated chip. 

   The impact of Moore's Law on modern life is not overemphasized as We can't take a plane ride, make a call, or even turn on our dishwashers without encountering its influence. Without it, we would not have found the Higgs boson, created the internet or the very foundations of cloud computing would not have been laid.

What is Cloud Computing? 

  Cloud Computing is computing in which large groups of remote servers are networked to allow centralized data storage and online access to computer services or resources. Clouds can be classified as public, private or hybrid. Basically, cloud treats computing as a utility rather than specific product or technology. 
  Cloud computing evolved from the concept of utility computing and can be thought of as many computers pretending to be one computing environment. Cloud computing exhibits these key characteristics essential for Data Warehousing or Business Intelligence such as
                        1. Agility                                                      5. Elasticity
                        2. APIs                                                        6. Multitenancy
                        3. Cost reductions                                       7. Scalability
                        4. Increased Productivity                             8. Reliability & Security
                                            9. Device and location independence.
  According to prevailing trends,  Moore's law will make it cheaper for companies to buy their own transistors in the form of private clouds, and to take hybrid approach in cases where they have bursty workloads. Public clouds will then be a place where startups go to get rapid scalability at low up-front costs, and where enterprises go to rent extra capacity when their private clouds are maxed out.

Real world implementations of Cloud Computing:


airbnb_horizontal_lockup_web   Airbnb is a community marketplace that allows property owners and travelers to connect with each other for the purpose of renting unique vacation spaces around the world through the company's website and mobile applications. Airbnb currently has hundreds of employees across the globe supporting property rentals in nearly 25,000 cities in 192 countries.


A year after Airbnb launched, the company decided to migrate nearly all of its cloud computing functions to Amazon Web Services (AWS) because of service administration challenges experienced with its original provider. Airbnb is significantly growing and to support demand, Airbnb uses 200 Amazon Elastic Compute Cloud(Amazon EC2) instances for its applications, memcache, and search servers. Within Amazon EC2, Airbnb is using Elastic Load Balancing, which automatically distributes incoming traffic between multiple Amazon EC2 instances. To easily process and analyse 50 gigabytes of data daily, Airbnb uses Amazon Elastic MapReduce (Amazon EMR) and to house backups and static files, it uses Amazon Simple Storage Service (Amazon S3) along with Amazon CloudWatch.


Airbnb was able  to complete its entire database migration to Amazon RDS  with only 15 minutes of downtime. Airbnb believes that AWS saved it the expense of atleast one operations position. Additionally, the company states that the flexibility and responsiveness of AWS is helping it to prepare for growth.


     Heineken sells its flagship premium beer in 178 countries, has long run innovative campaigns around the world. In 2012 campaign, based on the Bond movie Skyfall involved the primary digital content for the campaign which was 100-megabyte movie that had to be played flawlessly for millions of viewers worldwide. Heineken chose 

Microsoft Azure to help deliver the campaign successfully using the Azure Content Delivery Network to make the digital content available quickly, reliably and globally to 10.5 million consumers by supporting millions of users, minimizing latency and laying foundation for significant cost savings.

Similarly for another campaign where consumers could play a pinball game against each other from anywhere from the world during the UCL global campaign. Heineken wanted the technology to support 1 million simultaneous users with real time updating leader-boards. Heineken used Microsoft Azure to achieve 100 percent reliability on a massive scale. The platform exceeded its service-level agreement with perfect performance in the UCL campaign supporting 2 million gameplays per hour and capacity for more than 40 million players in all. 

The Future....

    With a ever shifting demand curve in the information technology domain, there is a need for synergy between the infrastructure and the technologies used to deliver the services and one of the factors influencing any business is the need for simplification of costs incurred in delivering a scalable, reliable and secure service model. Cloud computing in Data Warehousing and Business Intelligence can be an effective means in achieving the desired delivery model which can be both sustainable and cost effective in any scale of implementation.


References:


Thursday, March 5, 2015

Visual Representation of Data

When data is represented in textual format in a document it is difficult to get the essence of the data and draw conclusions from it. It is not impossible but it is time consuming to pull out the relevant data from the irrelevant facts and then draw specific conclusions from it. Also, it is shown that the human brain perceives images and charts better than it does text. When dealing with numbers it is always better to avoid displaying it in textual format. Tables and graphs are used to represent numerical data and it helps the user to understand better. While representing data, the target audience and the purpose the data serves for that audience should be considered.

Now, let us examine three types of data that we encounter in our day-to-day lives and what is the best way to represent it and why.

Banking Account Summary:
Everyone owns a banking account and often we like to check our account details especially the summary of the credit and debits each month. Here the information and numbers matter the most. The account holder needs to see every bit of information available. Hence, a tabular representation of the data will be most effective. This gives all the details in an exhaustive fashion.

Below is the representation of the account summary from one of the banks online:


Although I agree with this representation I would like it to be modified a little so that I can drill down on the either the credits or debits for the month and categorize the various expenses and group them for my understanding.

Telephone Bills:
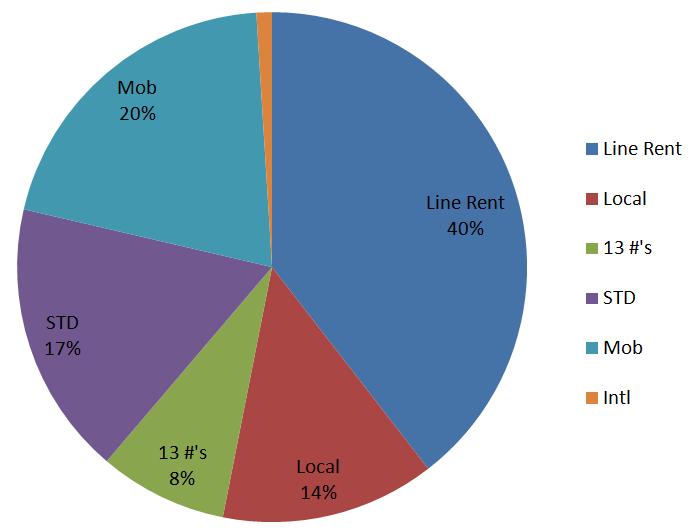
A classic example of large data in our day to day lives is our mobile phone bills. An individual need not know every data point in the phone bill but needs to know how the split up has been and the spikes (if there were any calls that cost more money than the rest). But the usual representation of the phone bills is as follows:


The above is very difficult to read and it is more difficult to draw conclusions from it. Hence I suggest pie charts to break up the total bill by its components and the usage of bar graphs to represent the number of hours on calling a particular number and the associated money spent. Below is an example of the pie chart.


FitBit Data:
Fitbit is a device that helps a person stay fit by tracking the number of steps a person takes everyday, the number of hours of sleep and even their dietary intake. Fitbit has become a common gadget among people who are health conscious. Fitbit also lets friends and family compete with one another regarding the number of steps and the calories burnt. 

An amazing feature of fitbit is its dashboard. It is highly colorful and very easy to read with many graphs. I wanted to include fitbit in this discussion mainly to highlight how technologies can use BI tools to visually represent their data in a readable format.


Conclusion:
Many of the old organizations are trying to re-evaluate how to represent their data. for some organizations like banks, the usual tabular representation works but for others like telephone companies, it does not work. Also the new organizations like fitbit have adopted the visualization of data and have taken it to new heights. Thus organizations should reconsider what is the right way to represent the data for their customers and incorporate more visualization in the future.
References:

Wednesday, February 18, 2015

The Analysis of Different Types of Data


Data is of many forms; some may comprise of a single word while some might encompass numbers; some forms of data may be pictures, videos or audio files even. Anything that could lead to the assimilation of useful information is considered valuable data and currently, all data is considered valuable.

Structured Vs Unstructured data
Structured data is found in fixed field within a field or a file in a relational databases and spreadsheet. It is easier to store, update and query the structured data fields. Data was usually structured for a long time. Work was done on the data to make it structured before storing it. Especially business analyst felt they could manipulate only atomic data. For some time, data that was not in the structured format was not stored and analyzed. 

Unstructured data refers to the data that does not have any predefined structure. It could be a free form text field that consists of dates, numbers and various other important data points. A good example of unstructured data is social media sites like Twitter and Facebook. Patient data stored in a hospital database is another good example of unstructured data because this data contains free form text fields describing the ailments and also lab reports.

It can be seen that the structured data is well prepared to be stored in specific formats in the specified location like say a database and corporations know very well how to handle them. But unstructured data is too large to be fit into rows and columns. Converting unstructured data into structured data is very difficult and unnecessary because the data will lose its significance in the conversion. Also, ideally, structured data should be simplistic in nature.

Different Data Types and their Warehousing:
Today, every organization wants to save the big unstructured data along with the structured data. By 2012, most of the organizations had started to incorporate big data. The below figure shows the growth of different types of data in an organization as of 2012.


The growth of unstructured data was on the rise and it is still rising with the break through in technologies like Hadoop, hive to manage the big data and the rise of no SQL databases like MongoDB. With the advent of Cloud computing, the size of big data is no more an issue as it used to be. In spite of all this, there is a recent survey that suggests that many database specialists struggle with no sql database and many more want one platform to handle both structured and unstructured data.

Data warehousing is the science of making sense of different data to better answer the questions about the business. To make sense of a perfectly structured data using Data warehousing techniques is a challenge faced by many organizations and so to warehouse big unstructured data is a challenge in itself.

Data warehousing categorically determines the kind of analysis that is possible with the data at a time when the data enters into the system. This is a good technique for unchanging, atomic structured data. But when it concerns the dynamic big data from social media, this technique fails. Many companies are trying to come up with solutions to help traditional data warehousing systems to deal with the uncertainties of the big unstructured data.

Data Warehousing in the Age of Big Data
Business Intelligence/Data Warehousing has provided a novel means to assimilate data into the business processes and help visualize the data. This helps the senior management to understand the business better. This is very different from big data. Big data is a means to store very large unstructured data.

Since big data poses challenges to the traditional data warehousing systems, the big data vendors like hadoop have come up with a hybrid transaction processing system. The difference between the 2 is shown below:


Though the new method offers real time analysis, the traditional DW/BI is not going anywhere. Most of the organizations already use DW tools and will continue to use them. Also the visualization offered by the BI tools is very helpful for the senior management to make informed decisions from the data. Though big data is new and dynamic, it has many gaps and can never be completely relied upon to make decisions. DW/BI tools will continue to work on the data and help businesses prosper.

References:
http://www.theregister.co.uk/2012/10/08/big_data_revolution/
http://www.webopedia.com/TERM/S/structured_data.html
http://en.wikipedia.org/wiki/Unstructured_data
http://www.kpipartners.com/blog/bid/137981/Structured-Data-vs-Unstructured-Data
http://www.theregister.co.uk/2012/10/08/big_data_revolution/
http://www.stocknewsnow.com/newsrss/1986581-Technology
http://www.onapproach.com/7-challenges-consider-building-data-warehouse/
http://searchbusinessanalytics.techtarget.com/feature/Big-data-vendors-should-stop-dissing-data-warehouse-systems
http://www.kdnuggets.com/2014/06/data-lakes-vs-data-warehouses.html
http://www.infoworld.com/article/2607810/cloud-computing/the-cloud-and-big-data-are-no-threat-to-data-warehouses.html
http://timoelliott.com/blog/2014/04/no-hadoop-isnt-going-to-replace-your-data-warehouse.html